How to Read Physics Graphs: Axes, Slope and Area
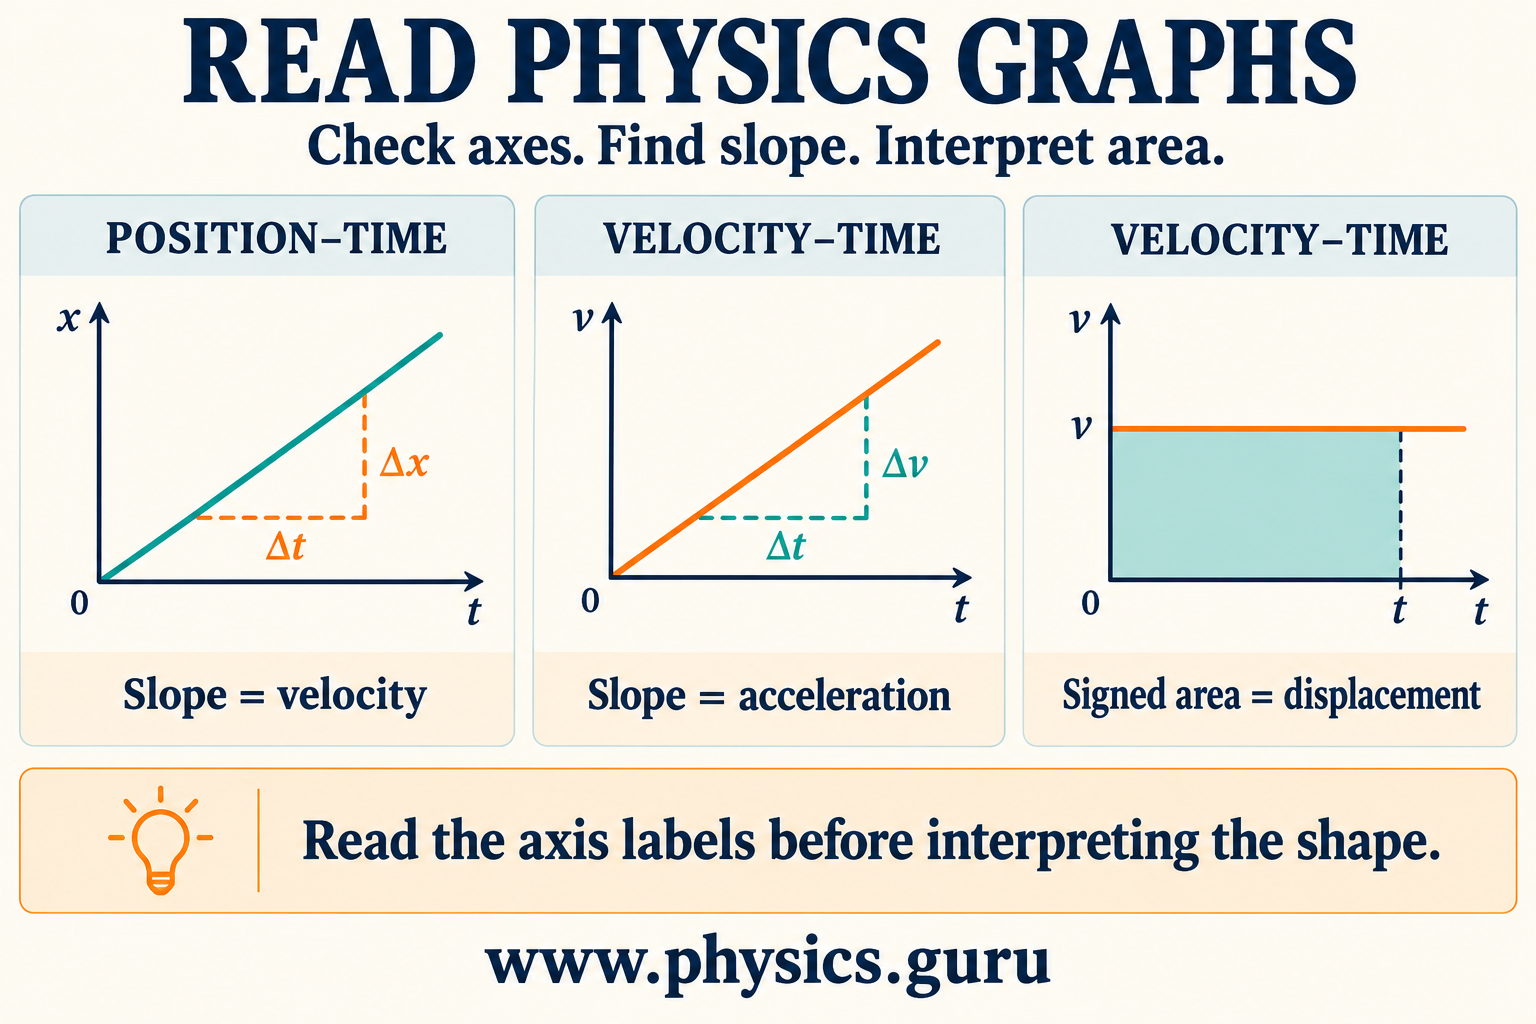
Learn to read position-time and velocity-time graphs using axes, slope and signed area, with worked examples and a practical student checklist.
A graph is a story, not a picture of the path
A rising line in a Physics question does not automatically mean that an object is moving uphill or speeding up. The meaning depends on the quantities plotted. Before calculating anything, say what each axis measures. This small habit prevents a surprisingly large number of mistakes.
Motion graphs are a useful starting point for Classes 9–12 and for students revising fundamentals before entrance-exam practice. The aim is not to memorise a collection of shapes. It is to connect each shape to a physical statement that you can explain in ordinary language.
First read the axes, units and scale
Write down the vertical quantity, the horizontal quantity and their units. Then inspect the scale: one square might represent two seconds rather than one. Check whether an axis begins at zero and whether negative values appear.
For example, a horizontal position-time line says that position is unchanged: the object is at rest over that interval. A horizontal velocity-time line above zero says something different: the object is moving with constant positive velocity. The shape is identical; the axis labels change the story.
Do not judge numerical steepness by the apparent angle on the page. A stretched axis can make a line look steeper without changing the motion. Use the labelled coordinates.
Slope tells you a rate of change
Slope is change in the vertical quantity divided by change in the horizontal quantity. On a position-time graph, it gives velocity. For a straight segment, choose two clear points and calculate Δx/Δt. If position changes from 2 m at 1 s to 10 m at 5 s, the velocity is (10 − 2)/(5 − 1) = 2 m/s.
On a velocity-time graph, slope gives acceleration. If velocity rises uniformly from 3 m/s to 11 m/s in 4 s, the acceleration is (11 − 3)/4 = 2 m/s². Notice that the units reveal which quantity you have calculated.
For a curved position-time graph, the slope of the line joining two points gives average velocity over that interval. The tangent at one point gives instantaneous velocity. Start with straight segments before practising tangents; accuracy matters more than rushing into complicated curves.
Area has a meaning only when the axes support it
On a velocity-time graph, the signed area between the graph and the time axis gives displacement over the chosen interval. For a constant velocity of 4 m/s lasting 3 s, the rectangular area is 4 × 3 = 12 m. If velocity increases uniformly from zero to 6 m/s in 4 s, the triangular area is ½ × 4 × 6 = 12 m.
These two journeys have the same displacement, but not the same velocity history. This is why a final number alone does not fully describe motion.
Do not assume that area always means displacement. Multiply the axis units first: (m/s) × s gives metres. The area under a position-time graph would have units m·s, so it is not a distance.
Keep displacement and distance separate
Area above the time axis contributes positively to displacement; area below contributes negatively. Suppose an idealised velocity-time graph has velocity +3 m/s for 2 s, then −2 m/s for 2 s. Ignoring the instantaneous change at the join, the signed areas are +6 m and −4 m.
The displacement is therefore +2 m, while the total distance travelled is 6 + 4 = 10 m. To find distance from a velocity-time graph, add the magnitudes of the areas after splitting the graph wherever velocity changes sign.
A negative velocity indicates motion in the chosen negative direction, not necessarily slowing down. To decide whether speed is increasing, compare the signs of velocity and acceleration. Matching signs mean increasing speed; opposite signs mean decreasing speed.
Try a five-minute graph check
Sketch a velocity-time graph that starts at zero, rises in a straight line to 8 m/s at 4 s, then stays at 8 m/s until 7 s. Before calculating, describe both stages in words.
Now find three things: acceleration during the first stage, displacement during that stage, and total displacement. The answers are 2 m/s², 16 m and 40 m. The last answer combines a triangle of area 16 m with a rectangle of area 24 m.
If your answer differs, locate the specific error: reading the scale, choosing slope instead of area, missing a factor of one-half, or dropping units. Then redraw the graph and solve it without looking at the solution.
Use the method in your next practice session
For your next three graph questions, write one sentence about the axes, one about the physical meaning of the shape, and one about why you need slope or area. Parents can help by asking students to explain those sentences rather than simply checking the final answer.
If you need support interpreting graphs or rebuilding motion concepts, use the course enquiry option on www.physics.guru and mention your class, target exam and one graph question you found difficult. A specific doubt makes the next learning step clearer.