IIT Madras’s 100+ Brain Mapping Mission: What a 3D Brain Atlas Can Reveal
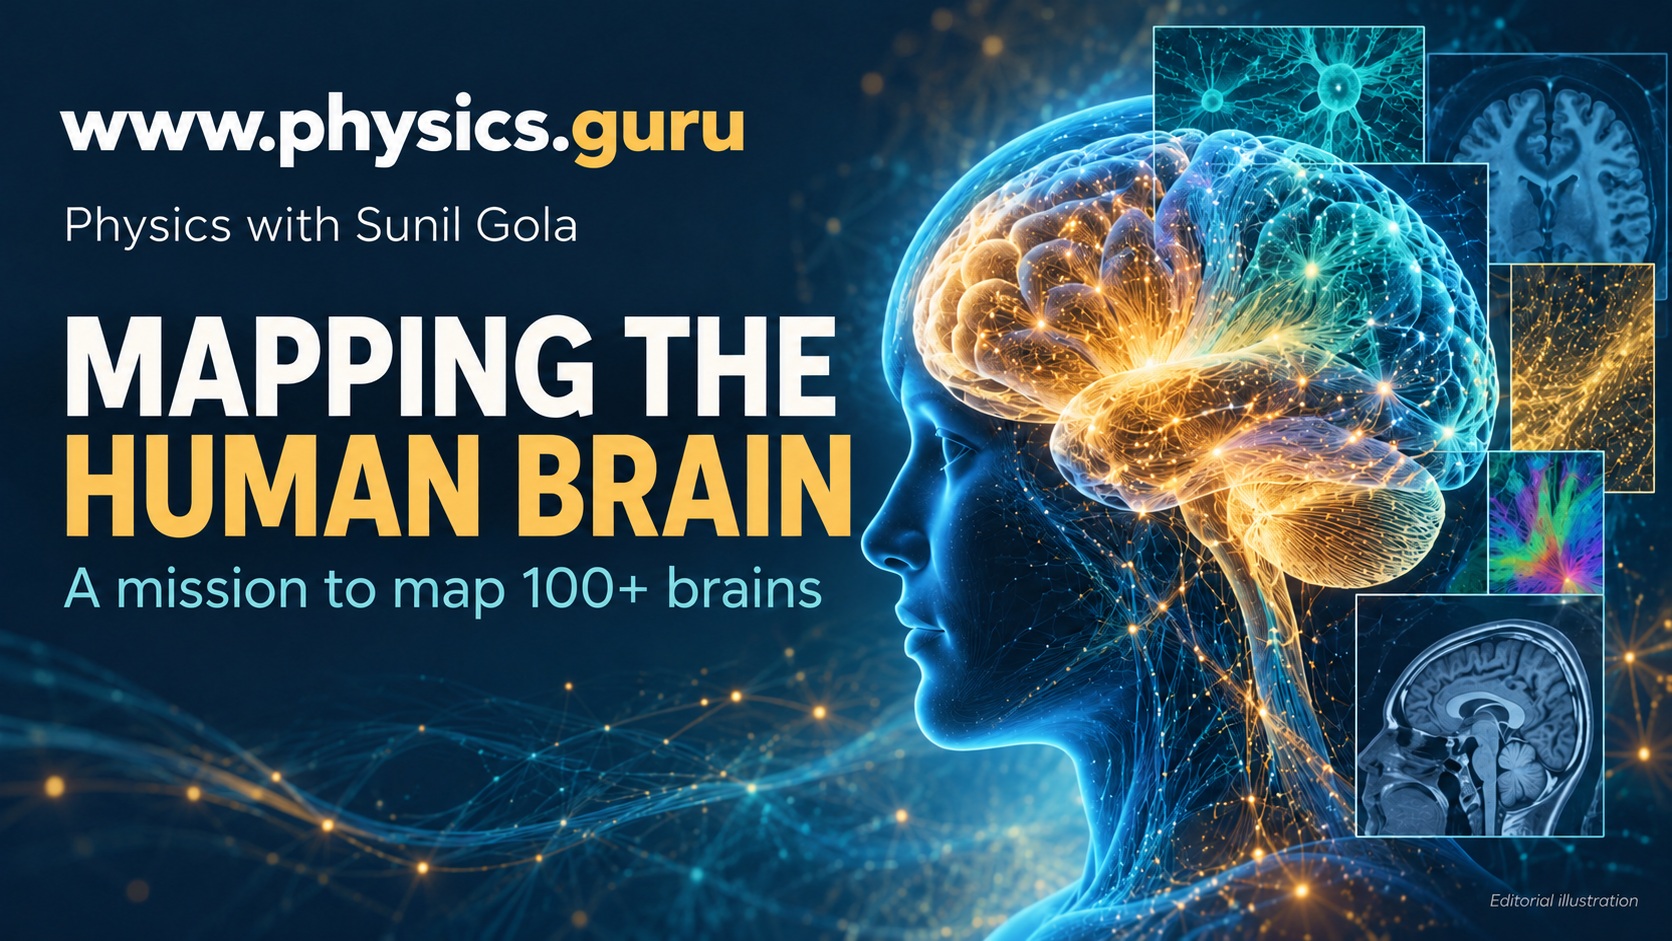
Discover IIT Madras’s mission to map over 100 human brains, how 3D atlases work, and why imaging brings Physics, Biology and computing together.
A mission launched in October 2026
IIT Madras announced on 12 October 2026 that its Sudha Gopalakrishnan Brain Centre had launched a mission to create three-dimensional, cell-resolution atlases of more than 100 human brains. The launch took place on 11 October. The planned collection spans stages of life and includes brain-related disease.
The centre works with post-mortem human brain tissue using imaging and computing methods. The announcement also described the release of C-STROKE, an atlas connecting clinical MRI with detailed histology of a stroke-affected brain. The mission’s target of more than 100 brains should not be mistaken for a claim that all those maps have already been completed.
What is a brain atlas?
An atlas organises information about where structures are located. A familiar school map labels rivers and cities; a brain atlas can identify regions, layers or cell populations using scientific imaging and annotation. Its usefulness depends on the questions it is designed to answer, the resolution of the measurements and the information recorded alongside each image.
The NIH’s brain-cell mapping programmes illustrate why different kinds of evidence matter. Anatomical location, cellular features and molecular characteristics can describe different aspects of the same tissue. No single colourful image automatically contains all those measurements. Researchers must explain what each dataset actually shows and how its labels were established.
From thin sections to a three-dimensional view
A useful existing example is IIT Madras’s DHARANI resource. Its public portal combines detailed histological images with post-mortem MRI and reconstructed volumes of developing human brains. This earlier resource is distinct from the newly announced 100-plus-brain mission and helps demonstrate what an accessible digital atlas can contain.
In broad terms, serial tissue images must be arranged in their correct spatial relationships to reconstruct a volume. Imagine photographing consecutive pages of a shaped paper model and then rebuilding its three-dimensional form. Biological tissue is much more complicated: scientists must address distortions, alignment and the interpretation of visible structures. This analogy explains reconstruction without pretending it is a simple stacking exercise.
Where Physics enters neuroscience
Microscopy connects this work with lenses, image formation, contrast and resolution. Magnification makes a feature appear larger; resolution concerns whether nearby features can be distinguished. Enlarging a blurred photograph does not create missing detail. That distinction is valuable when reading any claim about high-resolution scientific imaging.
Computing adds another layer. An image has positions, intensity values and scale information that must remain consistent when it is compared with another image. For students interested in engineering or medicine, brain mapping offers a concrete reason to take measurement, units and data interpretation seriously alongside Biology.
What a structural map cannot establish by itself
A map of tissue is not a recording of someone’s thoughts, a complete explanation of consciousness or an automatic treatment for disease. Structural observations can guide research questions, but establishing how a living system functions requires appropriate additional experiments and evidence.
The NIH’s scientific planning for brain research distinguishes structural maps from measurements of activity and circuit function. For a student, the lesson is straightforward: seeing where a component is located and knowing exactly what it does are related but separate achievements. Medical applications require further validation rather than being guaranteed by the appearance of an atlas.
A scale exercise for aspiring doctors and engineers
Start with the conversion that one millimetre equals 1,000 micrometres. Then imagine a square measuring one millimetre on each side, sampled using square pixels one micrometre wide. It would contain 1,000 pixels along each side and one million pixels in total. This is an illustrative calculation, not the centre’s reported scanning specification.
If the same side length is sampled twice as finely, the number of pixels across each side doubles, so the total increases fourfold. Explain why storing more detail can quickly increase data requirements. Next consider a three-dimensional volume: doubling the sampling along all three directions increases the number of volume elements eightfold.
Finally, choose a scientific atlas image with a teacher or parent and identify its scale bar, section orientation and legend. Write down one observation supported by the picture and one question it cannot answer. This short exercise practises the distinction between evidence and interpretation.
Strengthen the Physics that supports medical science
www.physics.guru offers Physics teaching for Classes 9–12 and NEET, JEE and CUET preparation with Sunil Gola, a DTU alumnus with 18 years of experience. Students can enquire about Sector 85, Gurugram classroom learning or live interactive online classes available worldwide.